The answer is why it can be hard to detect, let alone prohibit, partisan gerrymandering.
It's easy to understand why President Trump and Republicans point to the Massachusetts congressional map in their push to justify redistricting in Texas and other red states.
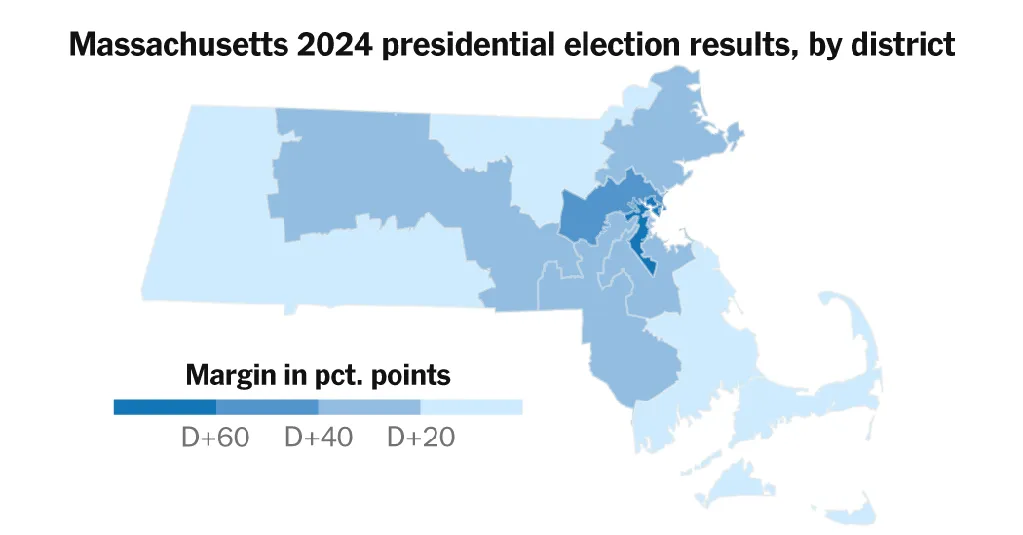
Last year, Mr. Trump won 36 percent of the state's vote, but neither he nor Republican House candidates managed to win even one of nine congressional districts. The state's map plan has been ranked as "more skewed" than 95 percent of plans nationwide by PlanScore, a nonprofit group that is advised by legal scholars, political scientists and mapping experts.
It certainly sounds unfair, but is it a gerrymander? That's not so simple.
While it might seem reasonable to expect that Republicans would win three or four seats with more than a third of the presidential vote, it's really not obvious that Republicans should win a single district in Massachusetts, let alone three.
The problem is geography -- or more specifically, the geographic distribution of a party's voters across the state. For better or worse, congressional districts represent the voters of the different geographic areas of a state; they don't directly represent a state's voters. There is no guarantee that the state's population as a whole will be well represented by the winners of each of a state's geographic areas. This is at the heart of why it can be hard to detect -- let alone prohibit -- partisan gerrymandering.
Imagine, for instance, a state that votes 60-40 for one party, with every neighborhood voting 60-40. If so, it is impossible to draw a district for the minority party: While there are plenty of minority party voters, there's no area that can be drawn to represent that party's voters.
Massachusetts poses a similar version of this problem. Mr. Trump won a respectable 36 percent of the vote, but he didn't win areas containing anywhere near 36 percent of the state's population. Instead, he won areas containing only about 15 percent of the state's population.
The relatively small number of Trump-voting towns and neighborhoods makes it much harder to draw a Trump district than it might initially seem. Each district in Massachusetts must represent one-ninth of the state's population; for one of them to back Mr. Trump, much of the state's Trump-voting area would need to be drawn into one district. But these Trump neighborhoods are scattered through the state and they didn't usually back him by a wide margin.
If you took any person in Massachusetts and formed a district around the 780,000 people who lived closest to that person, every one of those districts would have voted for Kamala Harris.
It's not impossible to draw a Republican district, but it's not easy.
Now, just because it's hard to draw a district doesn't mean the district shouldn't be drawn. But in this particular case, the typical standards for nonpartisan redistricting -- and the rules of many states -- would argue against the creation of this Trump district. Congressional districts are usually supposed to be compact. They're supposed to keep counties and cities together, rather than split them up. While these standards are nonpartisan, they will tend toward the creation of a 9-0 map in Massachusetts.
Importantly, none of the state's counties -- usually the building blocks of nonpartisan districts -- voted for Mr. Trump. This makes it fairly unlikely that anyone would draw a Trump district in the state, unless it was part of a deliberate effort. Indeed, the above Trump district wove through five different counties.
Computer-drawn maps help illustrate the problem.
In 2022, a team of political scientists used algorithms to draw 5,000 simulated maps for every state. The districts aren't drawn the way a human would. But the simulations do attempt to draw compact districts that respect county and municipal lines. They don't consider partisanship, one way or another.
Of the 5,000 maps the research project drew for Massachusetts, only three included a district that would have voted for Mr. Trump in 2024 -- and by a tenth of a point.
All three drew that district in a similar place, in southeastern Massachusetts:
It's important to emphasize that there's nothing wrong with the above district. It's compact and it doesn't unnecessarily weave through any counties. There's an argument that the Massachusetts congressional map would be better and fairer with a seat like this -- at least one that's competitive. But even one Trump district falls well short of giving Republicans the representation they'd receive in a system that purely reflected the share of the popular vote.
It doesn't necessarily follow that the 4,997 maps that would have created only Harris districts were gerrymanders, either. Indeed, the current Massachusetts map was passed with bipartisan support and signed by a Republican governor, Charlie Baker.
Geography can hurt Democrats, too, of course. When they win Wisconsin, for instance, they almost never win areas containing half of the state's population. Instead, they win with enormous margins in Madison and Milwaukee. Based on the usual nonpartisan standards for compactness and preserving whole cities, those two areas would be entitled to their own districts. And once you draw districts for those two blue bastions, there’s really nowhere else to draw a Democratic district in the state.
An overwhelming majority of the computer simulations yield a 6-2 split in favor of Wisconsin Republicans—the same split that exists today—even though the state popular vote is evenly divided. The maps with additional Democratic districts usually split the state’s most Democratic counties or cities, something that would probably never be considered except to achieve a partisan outcome.
Does this make a 9-0 map in Massachusetts or a 6-2 map in Wisconsin fair? It depends what you mean by fair. One of the most important debates in redistricting is if fairness should be judged based on whether it produces a fair partisan outcome, or whether it should be judged based on nonpartisan criteria like compactness.
In a way, it's reminiscent of the debate over whether colleges should use affirmative action or "colorblind" admission: Should congressional maps be party-blind, or should they try to provide adequate representation for each party? And if congressional maps should try to provide adequate representation, how far should they go to achieve it? Should Massachusetts draw that snaking, cross-county Republican district? Should Wisconsin slice up Madison and Milwaukee to join with rural areas? Or is that going too far? This basic question about what's truly "fair" can't be resolved by the data.
And just because geography explains the lopsided maps in Wisconsin and Massachusetts doesn't mean that most lopsided maps are simply about the distribution of a state's voters. In states like Texas and Illinois, partisan mapmakers are depriving political opponents of seats they would be entitled to based on nonpartisan criteria, like compactness and preserving counties and cities.
What geography does mean, however, is that you can't simply judge whether a map is a gerrymander based on whether a party wins seats in proportion to its state popular vote. And without that seemingly simple measure, it becomes much harder to identify a partisan gerrymander.